Helper functions
Beyond the core drawing primitives, c has a set of
helpers for the things tiny data panels do often: headers, label/value
rows, big stats, gauges, scores, sprites, mini charts. Every helper is built from
the same primitives, so anything a helper draws you could draw
yourself; they save you the math.
All coordinates follow the same rule as everywhere in GDN: (x, y) is the top-left
corner, x grows right, y grows down. Circles and dots are the exception; they
center on their coordinates.
You don't have to memorize any of these. In Glance Dev Studio, open the
Toolbox (or press Ctrl + B) to browse every helper with a live
preview and drop its code straight into app.star with a click.
This entire ops dashboard is one short page function:

def main(c, ctx):
    c.clear()
    y = c.header("OPS DASHBOARD", bg="purple", color="white", icon="bolt")
    c.status_dot(6, y + 5, "ok", label="API", font="4x7")
    c.status_dot(6, y + 15, "warn", label="DB", font="4x7")
    c.text("CPU", 70, y, font="4x5", color="gray", align="center")
    c.gauge(70, 30, 13, 72, color="green", label="72")
    c.kv(96, y + 1, "REQS", "1.2K", w=92, font="4x5")
    c.table([["US-EAST", "OK"], ["EU-WEST", "HOT"]], 96, y + 8, w=92,
            font="4x5", colors=["green", "amber"])
Every image on this page is a real render of the code right under it. Each snippet
is a complete page function you can paste into an app.star and run.
The full set at a glance
| Group | Helpers |
|---|---|
| Dashboard widgets | header kv stat gauge status_dot table scoreboard |
| Charts & indicators | progress_bar sparkline bars badge trend_arrow |
| Pixel art | sprite icon |
| Shapes | hline vline circle fill_circle triangle fill_triangle round_rect gradient_rect |
| Text layout | text_center text_right text_wrapped text_fit |
| Layout & color | grid color.dim clear |
Dashboard widgets
The prebuilt versions of the layouts almost every panel app converges on. Compare the Copy-paste snippets, which builds several of these by hand.
c.header(title, bg="green", color="black", font="5x7", icon=None)
A filled title bar across the top of the canvas with the title centered in it.
Pass an icon name to pin one of the bundled icons at the left edge.
Returns the y just below the bar, where your content starts.
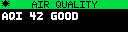
def main(c, ctx):
    c.clear()
    y = c.header("AIR QUALITY", bg="green", color="black", icon="sun")
    c.text("AQI 42 GOOD", 2, y + 2, font="6x8", color="white")
c.kv(x, y, key, value, w=0, font="4x7", key_color="gray", value_color="white", dots=None, gap=2)
One label/value row: key left-aligned at (x, y), value right-aligned at
x + w - 1 (w=0 means the rest of the canvas). Pass a color as dots for a
dotted leader between them. Returns the y of the next row, so rows stack.
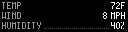
def main(c, ctx):
    c.clear()
    y = c.kv(2, 2, "TEMP", "72F", w=124)
    y = c.kv(2, y, "WIND", "8 MPH", w=124)
    y = c.kv(2, y, "HUMIDITY", "40%", w=124, dots="midgray")
c.stat(value, label, x, y, w=0, color="white", label_color="gray", fonts=None, label_font="4x5", align="left", gap=1)
A big-number stat: a small label above a large value. The value picks the
biggest font from fonts (default 16x20, 10x16, 8x12, 6x8) that fits in
w pixels and in the panel space left below it, so a stat under a header
shrinks automatically. With align="center" or "right", x is the center or
right edge of both lines. Returns the font used for the value.
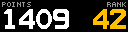
def main(c, ctx):
    c.clear()
    c.stat("1409", "POINTS", 2, 2)
    c.stat("42", "RANK", 126, 2, align="right", color="amber")
c.gauge(cx, cy, r, pct, color="green", bg="darkgray", label=None, label_color="white", font="4x5", thickness=3)
A semicircular dial gauge. The arc spans 180 degrees, sits on the line y = cy,
and fills left-to-right: pct is 0-100. r is the outer radius, thickness the
band depth. The optional label is drawn centered inside the dial.

def main(c, ctx):
    c.clear()
    c.text("CPU", 24, 1, font="4x5", color="gray", align="center")
    c.gauge(24, 27, 16, 72, color="green", label="72")
    c.text("MEM", 70, 1, font="4x5", color="gray", align="center")
    c.gauge(70, 27, 16, 35, color="amber", label="35")
c.status_dot(x, y, status, r=2, label=None, font="5x7", label_color=None)
A colored status dot centered on (x, y). status maps to a color: True,
"ok", "up", "online" are green; "warn" is amber; False, "error",
"down" are red; "off" and "unknown" are midgray. Anything else is used as a
color directly. The optional label sits to the right, vertically centered on the
dot, and defaults to the dot's color.
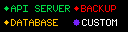
def main(c, ctx):
    c.clear()
    c.status_dot(6, 8, "ok", label="API SERVER")
    c.status_dot(6, 22, "warn", label="DATABASE")
    c.status_dot(76, 8, False, label="BACKUP")
    c.status_dot(76, 22, "#7521F9", r=3, label="CUSTOM", label_color="white")
c.table(rows, x, y, w=0, font="4x5", color="white", colors=None, header_color=None, aligns=None, line_gap=2)
A small text table: rows is a list of rows, each a list of cell strings. Column
widths come from the widest cell; the first column is left-aligned, the last
right-aligned, and the leftover space spreads between them (override per column
with aligns, e.g. ["left", "center", "right"]). colors styles whole rows
(None entries fall back to color); header_color restyles row 0.
Returns the y just below the last row.
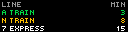
def main(c, ctx):
    c.clear()
    c.table([
        ["LINE", "MIN"],
        ["A TRAIN", "3"],
        ["N TRAIN", "8"],
        ["7 EXPRESS", "15"],
    ], 2, 2, w=124, header_color="gray",
       colors=[None, "green", "amber", "white"])
c.scoreboard(home, away, home_score, away_score, status="", home_color="yellow", away_color="cyan", score_color="white", x=0, y=0, w=0)
The classic two-team score layout: names in the top corners, big scores under
them, an optional status ("Q4", "FINAL", "7TH") centered at the top.
Fills the whole canvas width by default; pass x/y/w to inset it.
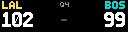
def main(c, ctx):
    c.clear()
    c.scoreboard("LAL", "BOS", 102, 99, status="Q4")
Charts & indicators
c.progress_bar(x, y, w, h, pct, color="green", bg="darkgray", border=None)
A horizontal bar; pct is 0-100. Optional 1px border.
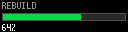
def main(c, ctx):
    c.clear()
    c.text("REBUILD", 2, 2, font="4x7", color="gray")
    c.progress_bar(2, 13, 124, 8, 64, color="green", bg="darkgray", border="midgray")
    c.text("64%", 2, 24, font="4x7", color="white")
c.sparkline(values, x, y, w, h, color="green", fill=None, min_val=None, max_val=None)
A mini line chart of a list of numbers, scaled to fill the box. fill shades the
area under the line. By default it scales to the min/max of your data (a flat
list draws mid-height); pass min_val/max_val for a fixed scale.
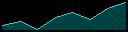
def main(c, ctx):
    c.clear()
    prices = [187, 189, 185, 191, 194, 190, 196, 199]
    c.sparkline(prices, 2, 2, 124, 28, color="cyan", fill=color.dim("cyan", 30))
c.bars(values, x, y, w, h, color="green", gap=1, min_val=None, max_val=None)
A mini bar chart, bars rising from the bottom of the box. Scaling works exactly
like sparkline.
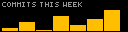
def main(c, ctx):
    c.clear()
    c.text("COMMITS THIS WEEK", 2, 2, font="4x5", color="gray")
    c.bars([3, 5, 2, 7, 4, 6, 9], 2, 10, 124, 21, color="amber")
c.badge(s, x, y, color="black", bg="green", font="5x7", pad=2)
A filled pill with text inside. Returns its total width, so you can place the next thing right after it.
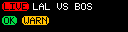
def main(c, ctx):
    c.clear()
    w = c.badge("LIVE", 2, 2, color="black", bg="red")
    c.text("LAL VS BOS", 2 + w + 4, 3, font="5x7", color="white")
    c.badge("OK", 2, 16, color="black", bg="green")
    c.badge("WARN", 22, 16, color="black", bg="amber")
c.trend_arrow(x, y, direction, color=None)
A 5x5 up/down/flat arrow. direction is a number (>0 up, <0 down, 0 flat)
or "up"/"down"/"flat". Colors default to green/red/gray.

def main(c, ctx):
    c.clear()
    c.trend_arrow(4, 6, 1)
    c.text("+2.4%", 14, 5, font="5x7", color="green")
    c.trend_arrow(4, 20, -1)
    c.text("-1.1%", 14, 19, font="5x7", color="red")
    c.trend_arrow(54, 13, 0)
    c.text("0.0%", 64, 12, font="5x7", color="gray")
Pixel art
c.sprite(art, x, y, color="white", legend=None, scale=1)
Draw pixel art straight from a string, no 0/1 matrices needed. Rows are
separated by newlines; spaces and dots are empty, and any other character lights a
pixel in color. Pass legend (a dict of character to color) for multi-color
art; a legend value of None turns that character off. Leading and trailing blank
lines are ignored, so triple-quoted strings work as-is. scale enlarges each art
pixel by a whole factor. Also accepts a list of row strings.

INVADER = """
..X.....X..
...X...X...
..XXXXXXX..
.XX.XXX.XX.
XXXXXXXXXXX
X.XXXXXXX.X
X.X.....X.X
...XX.XX...
"""

SHROOM = """
...RRRRR...
..RRWWRRR..
.RRWWRRWRR.
.RRRRRWWRR.
.RRRRRRRRR.
...TTTTT...
...TTTTT...
....TTT....
"""

def main(c, ctx):
    c.clear()
    c.sprite(INVADER, 4, 12, color="green")
    c.sprite(INVADER, 26, 4, color="green", scale=2)
    c.sprite(SHROOM, 62, 12, legend={"R": "red", "W": "white", "T": "#C89858"})
c.icon(name, x, y, color="white", scale=1)
Draw a bundled 8x8 pixel-art icon by name, in any color. scale enlarges it by a
whole number. An unknown name simply draws nothing.

def main(c, ctx):
    c.clear()
    c.icon("sun", 4, 4, color="amber")
    c.icon("cloud", 18, 4, color="skyblue")
    c.icon("bolt", 32, 4, color="yellow")
    c.icon("heart", 46, 4, color="red")
    c.icon("wifi", 64, 4, color="green", scale=2)
    c.text("ICON SET", 4, 20, font="5x7", color="gray")
The 23 bundled icons (an unknown name simply draws nothing):
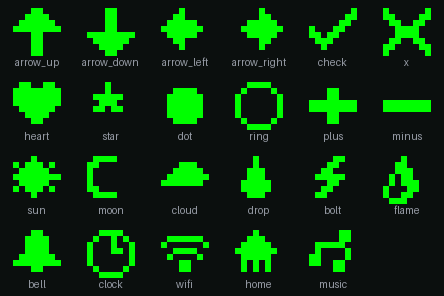
For custom art, c.sprite() above draws from a single string, or see
bitmaps.
Shapes
c.hline(x, y, w, color) and c.vline(x, y, h, color)
Straight horizontal/vertical lines from (x, y), w pixels wide or h pixels
tall.

def main(c, ctx):
    c.clear()
    c.hline(4, 7, 88, "green")
    c.hline(4, 24, 88, color.dim("green", 40))
    c.vline(48, 4, 24, "amber")
c.circle(cx, cy, r, color) and c.fill_circle(cx, cy, r, color)
Circle outline / filled circle. Circles are the one shape that centers on its
coordinates: (cx, cy) is the center pixel and the circle spans r pixels in
every direction from it.

def main(c, ctx):
    c.clear()
    c.fill_circle(24, 16, 9, color.dim("red", 45))
    c.circle(24, 16, 12, "red")
    c.fill_circle(64, 16, 6, "cyan")
c.triangle(x0, y0, x1, y1, x2, y2, color) and c.fill_triangle(...)
Triangle outline / filled triangle through three points.

def main(c, ctx):
    c.clear()
    c.fill_triangle(10, 27, 26, 4, 42, 27, "amber")
    c.triangle(52, 27, 68, 4, 84, 27, "green")
c.round_rect(x0, y0, x1, y1, r, fill=None, outline=None)
Rectangle with rounded corners, radius r. Like rect, corners are inclusive;
pass fill, outline, or both.

def main(c, ctx):
    c.clear()
    c.round_rect(4, 4, 44, 27, 5, fill="darkgray", outline="green")
    c.round_rect(52, 4, 92, 27, 11, outline="purple")
c.gradient_rect(x0, y0, x1, y1, color_a, color_b, horizontal=True)
Rectangle filled with a smooth blend from color_a to color_b, left-to-right by
default, top-to-bottom when horizontal=False. Depth on a 32px panel without any
image.

def main(c, ctx):
    c.clear()
    c.gradient_rect(4, 4, 91, 14, "purple", "skyblue")
    c.gradient_rect(4, 18, 91, 28, "black", "green", horizontal=False)
Text layout
c.text_center(s, y, font="5x7", color="white")
Text centered across the whole canvas width.

def main(c, ctx):
    c.clear()
    c.text_center("GAME NIGHT", 3, font="7x12", color="amber")
    c.text_center("FRIDAY 8 PM", 20, font="5x7", color="white")
c.text_right(s, y, font="5x7", color="white", margin=0)
Text right-aligned to the canvas edge, inset by margin. (For a full label/value
row in one call, see c.kv.)
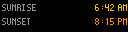
def main(c, ctx):
    c.clear()
    c.text("SUNRISE", 2, 4, font="4x7", color="gray")
    c.text_right("6:42 AM", 4, font="4x7", color="amber")
    c.text("SUNSET", 2, 18, font="4x7", color="gray")
    c.text_right("8:15 PM", 18, font="4x7", color="orange", margin=0)
c.text_wrapped(s, x, y, w, font="5x7", color="white", line_gap=2, align="left", max_lines=8)
Word-wraps into lines that fit width w, drawn downward from (x, y).
Returns the number of lines drawn.
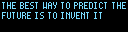
def main(c, ctx):
    c.clear()
    quote = "THE BEST WAY TO PREDICT THE FUTURE IS TO INVENT IT"
    lines = c.text_wrapped(quote, 2, 2, c.width - 4, font="4x7", color="skyblue")
c.text_fit(s, x, y, fonts, color="white", align="left", maxw=0)
Draws in the biggest font from the list that fits maxw (default: canvas
width). Returns the font it used.
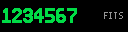
def main(c, ctx):
    c.clear()
    c.text_fit("1234567", 2, 8, ["16x20", "10x16", "8x12"], color="green", maxw=96)
    c.text("FITS", 104, 12, font="4x7", color="gray")
Layout: c.grid()
c.grid(cols, rows=1, pad=1) splits the whole canvas into evenly-spaced cells and
returns them as a list, so you can lay out columns without doing coordinate
math. It draws nothing on its own. Each cell is a dict with x0, y0, x1, y1
(corners), w, h (size), and cx, cy (center). Pass rows for a 2-D grid
(e.g. c.grid(4, rows=2) gives 8 cells).
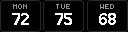
def main(c, ctx):
    c.clear()
    cells = c.grid(3, pad=2)
    labels = ["MON", "TUE", "WED"]
    temps = ["72", "75", "68"]
    for i in range(len(cells)):
        cell = cells[i]
        c.round_rect(cell["x0"], cell["y0"], cell["x1"], cell["y1"], 3, outline="darkgray")
        c.text(labels[i], cell["cx"], cell["y0"] + 4, font="4x5", color="gray", align="center")
        c.text(temps[i], cell["cx"], cell["y0"] + 13, font="8x12", color="white", align="center")
Colors: the color struct
Every color parameter takes a name ("green"), hex ("#00FF00"), or (r, g, b)
tuple. The global color struct adds named constants and one function:
| Constants | color.black white red green puregreen blue yellow orange cyan magenta amber pink purple skyblue gray darkgray midgray |
color.dim(c, pct) | That color at pct% brightness. color.dim("green", 50) is half-bright green. Useful for backgrounds, tracks, and fills under sparklines. |

def main(c, ctx):
    c.clear()
    c.fill_circle(20, 16, 10, color.dim("red", 40))
    c.circle(20, 16, 10, "red")
    c.text("DIM 40", 42, 6, font="4x7", color=color.dim("white", 40))
    c.text("FULL", 42, 18, font="4x7", color="white")
Convenience: c.clear()
Fills the whole canvas with black, the usual first line of a page.

def main(c, ctx):
    c.fill("darkgray")      # pretend the frame was full
    c.clear()               # back to black
    c.text("FRESH FRAME", 6, 12, font="5x7", color="green")
How helpers work (and sharing your own)
Helpers aren't new renderer features; each one expands into the same primitive
ops (rect, line, pixel, text, ...) at draw time. That means they render
identically in gdn preview, gdn studio, and on the panel, and the security
model is unchanged.
It also means you can write your own: any plain Starlark function that takes c
and calls c.* is a "helper", and you can share it by copy-pasting it between
apps.
def double_kv(c, y, k1, v1, k2, v2):
    c.kv(2, y, k1, v1, w=60)
    c.kv(66, y, k2, v2, w=60)

def main(c, ctx):
    c.clear()
    double_kv(c, 2, "HI", "75F", "LO", "58F")
    double_kv(c, 12, "WIND", "8", "GUST", "14")
See also: Drawing API · Copy-paste snippets · Fonts.